
A great tool for website builders
No website is built perfectly. Like all products made by humans, code errors are part of the process. That’s why it’s important to thoroughly test any new website you build to make sure that it’s as free of errors as possible to give your users the best possible experience.
You shouldn’t test a web site without trying Google Chrome’s DevTools kit first. Chrome developer mode allows you to try out and thoroughly test a new site (or an existing one) to find and fix bugs. It can also give you insight into how other sites are run, including viewing the source code.
Table of Contents
Here’s everything you need to know about the Google Chrome browser developer mode, what tools it has, and how to use it effectively.
What Is Chrome Developer Mode?
When we refer to the Chrome developer mode, we’re not talking about the same developer mode that you’ll see on Chromebooks. What we’re referring to is the extensive Chrome development tools (called Google DevTools) that are built into the browser itself.
These are tools designed to test, analyze, and purposely break (if you need to) a web page you’ve loaded in the Google Chrome browser for testing purposes. At a basic level, you can use DevTools to view the source code for a website, letting you peek under the hood to see how a site has been built and how well it runs.
Google DevTools offers more than this, however. You can use Chrome developer mode to change a page after it’s loaded, run Google Chrome console commands to control and manipulate the page, as well as run speed and network tests to monitor web traffic.
You can also emulate other devices, including different operating systems and screen resolutions, in the Chrome DevTools mode. This lets you see if a site has responsive web design, and where site content and layouts will change depending on the device resolution or type.
While these tools are aimed at professional web developers or testers, it’s also handy for standard Chrome users to know their way around the DevTools suite. If you see a problem with a site that you can’t solve, switching to Chrome developer mode can help you see if the problem is with the site or with your browser.
How To Access Google Chrome DevTools Menu
There are a few ways you can access the Google Chrome DevTools menu, depending on the tool you wish to use.
The easiest method to do this is from the Google Chrome menu. To do this, click the three-dots menu icon in the top-right. From the menu that appears, click More Tools > Developer Tools.
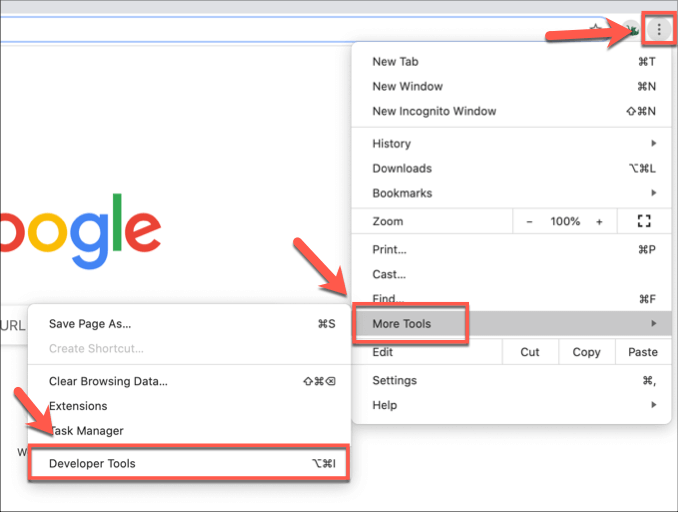
This will open the DevTools kit in a new menu on the right-hand side of your open Chrome tab or window.
You can also do this by using keyboard shortcuts. From a Windows or Linux PC, open the Chrome browser and press the F12 key. You can also press the Ctrl + Alt + J or Ctrl + Alt + I keys in an open Chrome tab or window.
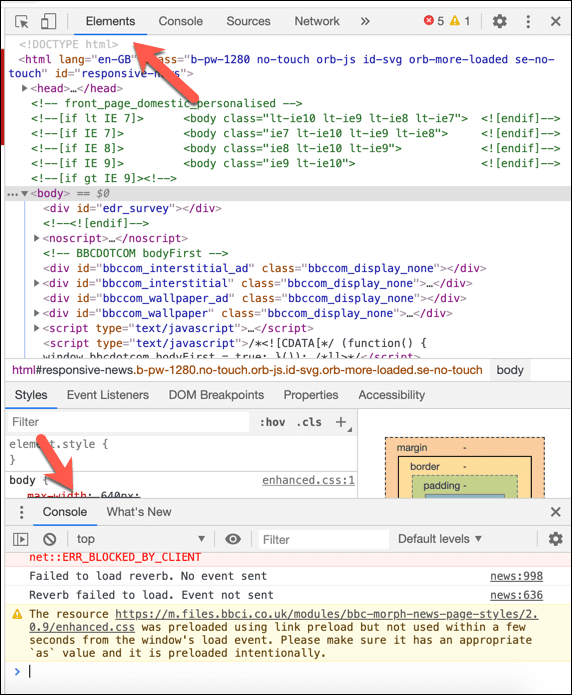
On macOS, press F12 or press the Option + Command + J or Option + Command + I keys to open the Chrome DevTools menu instead. This will open the Chrome console, with options to move to other Chrome tools at the top of the DevTools menu.
If you want, you can view the source code for a website (opening the Elements tab of the DevTools menu in the process) on any open web page by right-clicking the and clicking the Inspect option.
Using Chrome DevTools
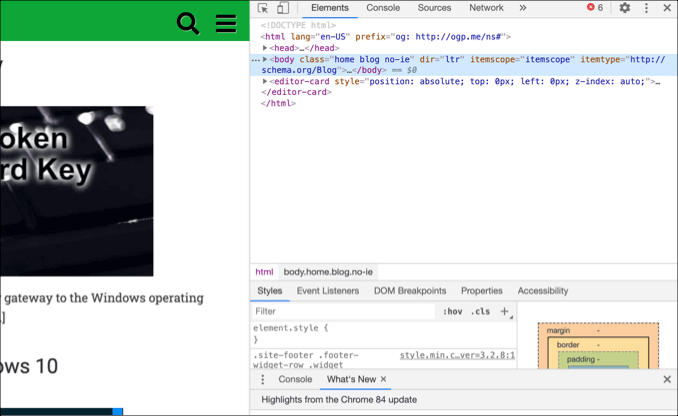
As we’ve briefly touched upon, you can use the Chrome DevTools kit to see the source code for a website under the Elements tab. It’ll let you analyse the code behind the page you’ve loaded, as well as view error messages (indicating problems with how the site has loaded) in the Chrome console under the Console tab.
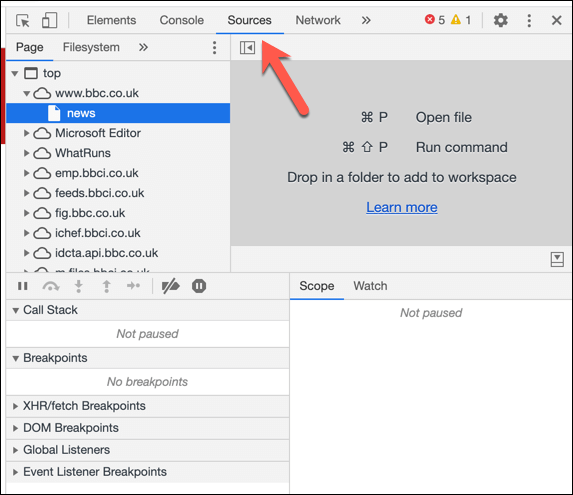
You can also view the different sources for content from a website under the Sources tab. For instance, if a site is using a content delivery network (CDN), media from a site would be listed as a different source here.
Chrome developer mode allows you to download that content directly, or perform more complex analysis of the content.
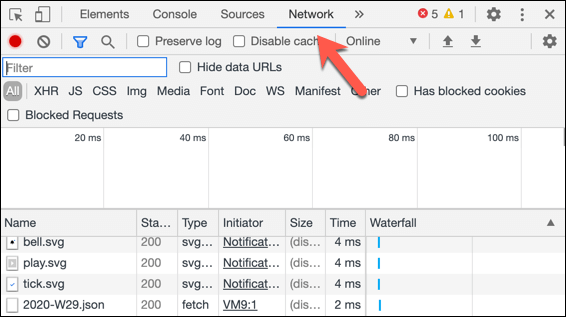
If you want to test how a site is performing, you can monitor and record your network usage under the Network tab. This will show the speed, size, and type of network requests made between your browser and the site.
For instance, when a page first loads, the site will load the page content itself, but it may also request data from third-party databases. For instance, when you sign in, this may query a database which would show up as a network request here.
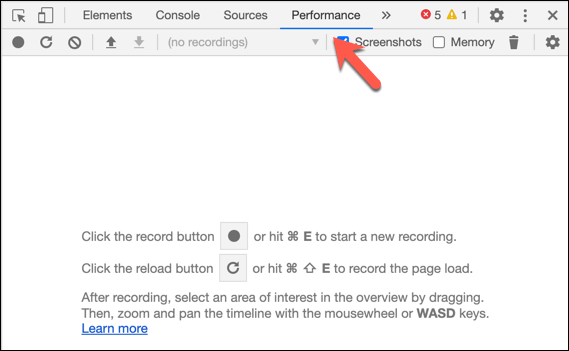
You can analyse this further under the Performance tab, where you can record your Chrome browser usage in greater depth, including recording screenshots at different points. This will log how long it takes to load your site for further analysis.
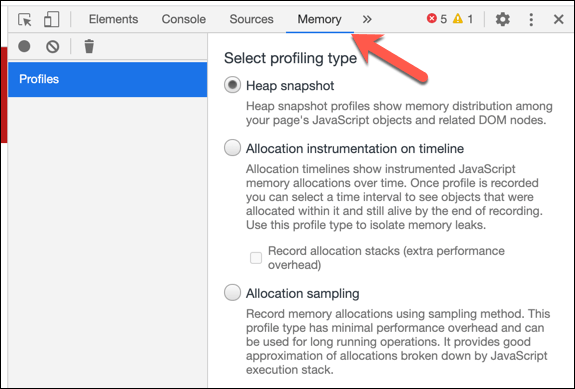
Google Chrome has a reputation for being hard on your PC memory, so you can test your site’s JavaScript memory usage under the Memory tab. Different Chrome testing profiles can be used here, with further information about this testing at the Chrome DevTools documentation page.
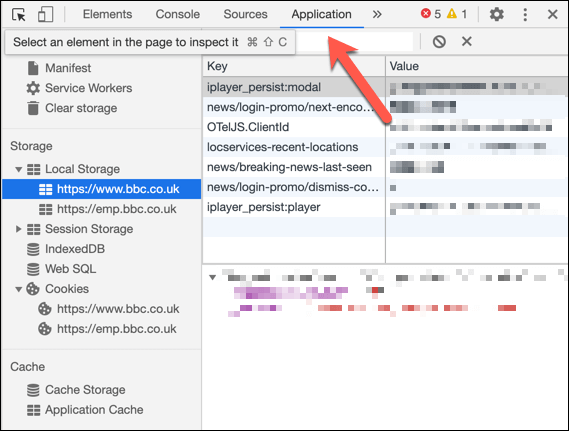
For more in-depth analysis of your site content, as well as any browser storage it might be using (for instance, to log data), you can search through the Application tab. You can view site cookie information here under the Cookies section, or clear the storage being used by clicking the Clear storage option.
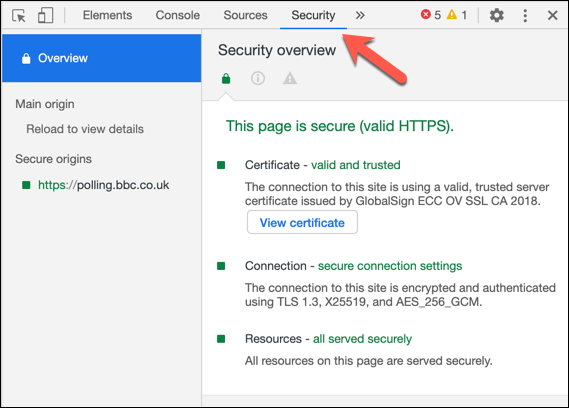
If you’re worried about your site security, you can check how well it performs under the Security tab. This will give you a quick overview of Chrome’s security analysis for a page, including whether or not the page has a correct and trusted SSL certificate.
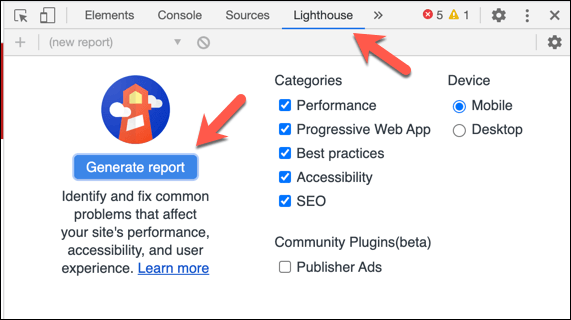
If you want to generate a report on your site’s performance, including if it meets typical user standards and if the site performance could be affecting search engine optimization, you can click the Lighthouse tab. This offers settings you can check or uncheck for your report—click Generate report to create the report to view.
This barely scratches the surface of the potential that Chrome developer mode can bring to developers. If you want to learn more, the Chrome DevTools documentation should help you with the tools and features on offer, including how to build your own user tests with it.
Advanced Google Chrome Tricks
Most Chrome users won’t ever know that the Google Chrome DevTools kit exists in their browser, but for power users, it remains an exceptionally useful way to test and analyse websites. There are also third-party Chrome extensions for web developers available to help test your site further.
If you’re building a basic website, switching to Chrome developer mode could help you spot errors with your site that aren’t immediately visible. You can only do this if Chrome is working correctly, so if you’re struggling with Chrome crashes, you may need to reset or reinstall your browser first.
Subscribe on YouTube!
Did you enjoy this tip? If so, check out our YouTube channel from our sister site Online Tech Tips. We cover Windows, Mac, software and apps, and have a bunch of troubleshooting tips and how-to videos. Click the button below to subscribe!
Subscribe